Spot-Test Your Flour. Instantly.
Upload a photo of your iron spot test. Our AI tool analyzes it and estimates iron content — right from your phone.
Analyzing image
Iron Spot Test Lab Report
| Parameter | Value |
|---|---|
| Estimated Iron Content | -- |
| Fortificant Used | -- |
| Flour Used | -- |
| Mill Code | -- |
| Sample Code | -- |
| Date | -- |
AI-estimated iron content based on image analysis. For reference only.
How It Works
- Run the iron spot test on a wheat flour sample using your standard test kit.
- Take a photo of the test spot with your mobile phone.
- Upload to the tool — the AI model analyzes color intensity and pattern.
- Get instant results on iron presence and relative content level.
How to Use
To select the model:
Option 1: Classification Model: Choose this if you want a simple result: Under-fortified, Within range, or Over-fortified.
Option 2: Regression Model: Choose this if you want an estimated iron value (mg/kg). Useful when you need a more detailed, numerical result.
Do's (Before Uploading Your Test Image)
- Do place your Petri dish on a clean, flat, light-colored (preferably white or grey) background for better contrast and image clarity.
- Do use a well-lit environment with white LED or daylight, and avoid shadows or warm/yellow lighting.
- Do hold your phone directly above the sample (top-down), keeping it parallel to the surface to avoid distortion.
- Do include a ruler or scale and, if available, a color reference card in the image for calibration.
Don'ts (Before Uploading Your Test Image)
- Don't use flash or overhead bulbs that create glare, as this may distort color detection.
- Don't capture at an angle — skewed images reduce accuracy in spot recognition.
- Don't crop out the Petri dish edges or reference scale — the full view is necessary for valid analysis.
- Don't upload blurry, unfocused, or shadowed images — the tool requires high clarity for reliable results.
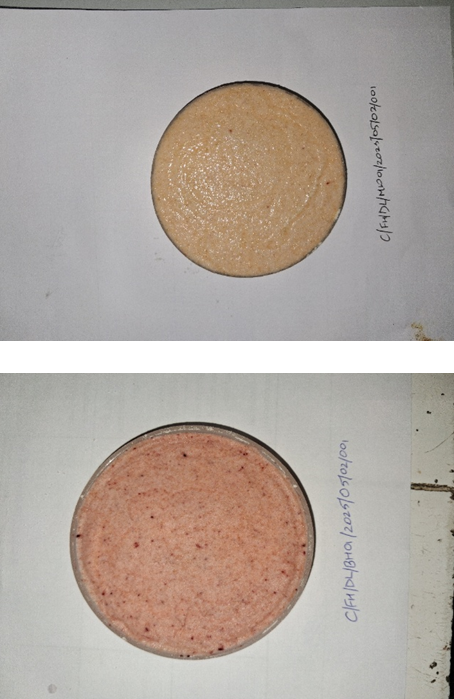
Sample Images